So why use web technologies?
The most prominent reason that comes to mind is that when you make something with web technologies it’s accessible by anyone with a web browser. You don’t need to install anything locally like you would with other types of platforms like R, or Python, or Java.
And in modern times there are advanced front-end engineering approaches that let you do some serious engineering work in JavaScript with web technologies. Very custom and bespoke design work is possible. There’s also unlimited potential for adding interactivity to your programs. These for me are the main reasons why you would want to use web technologies as opposed to some other technologies.
But what are web technologies?
HTML. Hypertext Markup Language. This is, you could say, the backbone of the web. All web pages are HTML documents, meaning they’re text files that contain this markup that’s called HTML hypertext markup language. Here’s an example of a page created with just HTML. With HTML, you can make large text with paragraphs with the H1 tag. Links with the “a” tag on any page. If you right-click and look at view page source with Ctrl + U, you can see the HTML source code behind it. Every HTML page starts with this doctype HTML to signify to the browser that okay, this is HTML5 that we’re dealing with, and then begin <html> tag corresponding to an end <html/> tag. A head that loads things that are not really visible on the screen, but have some effect, and then the <body> tag that loads things that you see on the screen. For example, an <h1> tag that makes text large and the <a> tag makes links. A <p> tag that makes paragraphs, and a <strong> tag that makes text bold. So that’s an example of a simple HTML page.
But HTML by itself has its limitations. That’s pretty much all you can do with HTML but if you want to make it look pretty you can add CSS to the mix. Cascading Style Sheets. This is one of my favorite websites that showcases the power of CSS. The CSS Zen garden. On this page, you can click on different CSS themes that load this exact same HTML, but it looks totally different just because the CSS changed. Let’s take a look at this other design. Can you believe that it’s the exact same HTML? The only thing that’s different is the CSS so you can sort of think of HTML as the skeleton and CSS as the skin you can use CSS to do this kind of skinning or theming to HTML you can do quite a bit of static web pages with HTML and CSS.
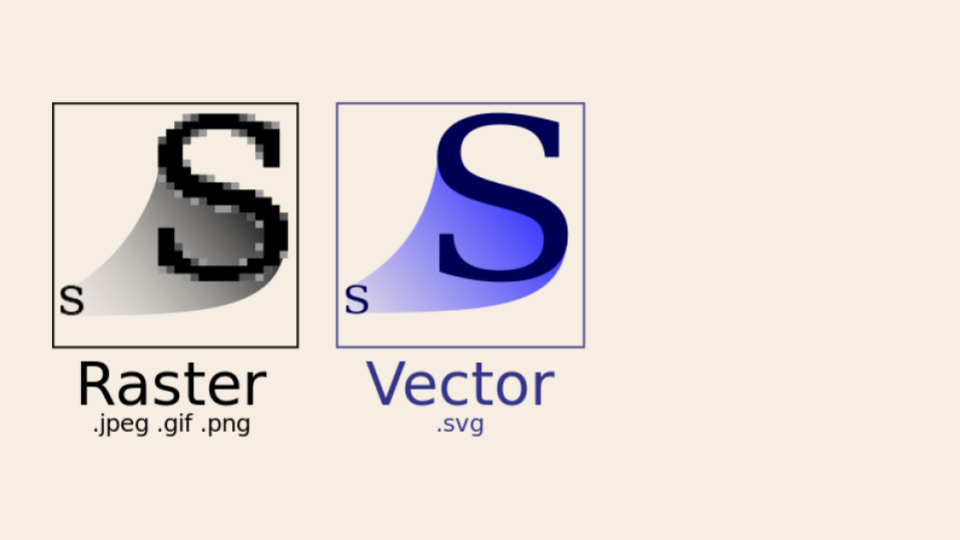
But once you want to add some cool graphics you need to turn to a graphics technology like SVG. Scalable Vector Graphics. This is what we’re going to use to make our data visualizations. I like to refer to the Wikipedia page on Scalable Vector Graphics because it has this really nice illustration of raster versus vector. A raster image means that the image is comprised of pixels. These little squares that make up the image. It’s just a listing of colors that should be on each pixel. Raster image formats include JPEG, TIFF, and PNG, and also the ancient dot BMP bitmap format. Raster images are in contrast to vector images like SVG – Scalable Vector Graphics. Vectors meaning the image is defined in terms of the shapes that comprise it, it’s not defined in terms of pixels. It’s defined in terms of shapes and paths. So when you scale it up, it remains crisp. It doesn’t get pixelated like raster images do. By the way, there are other graphics technologies for the web including HTML5, Canvas, and WebGL. Those are ultimately raster graphics technologies. They do give you better performance than SVG, but they don’t have that scaling aspect that SVG has. I find them more difficult to work with, so that’s why I’m choosing to use SVG for this course.

The Ghostscript Tiger is a popular image that people show when you know talking about SVG. Here’s a version of that image that’s actually a .PNG file, and notice that if you zoom in, it gets blurry. See? It’s actually defined by the pixels, and when you zoom in, the browser tries to make it look better by blurring in a little bit.. but it’s actually just a bunch of little rectangles. Here is the SVG version of that image. It doesn’t get blurry at all. As you zoom into it, we can inspect this SVG image, and see what its DOM elements look like. DOM meaning Document Object Model. See, it’s comprised of the elements that make up the image. Like here’s one whisker, for example. It’s a group element that has a path inside of it. And see, if I delete this path, that whisker disappears. So this is how SVG images are defined. They’re defined in terms of the elements that make up the graphic, not by pixels.
HTML, CSS, and SVG can only get us so far. We can only make things that are not dynamic, that are just fixed. If we want to add interactivity and dynamic behavior to our pages, then we need to use JavaScript. JavaScript is also what lets us algorithmically produce images based on SVG. For example, we can make this sine wave of circles using JavaScript and math functions the code for this particular program is not very big see it’s in a script tag means a JavaScript tag. This program uses D3 to create a bunch of circles and then sets a timer that executes every animation frame ideally 60 times a second and just updates the Y position of the circles. JavaScript is also what makes it possible to produce graphics like this, that are driven by data, and without JavaScript I don’t think it would be possible to add interactivity like this where you can do something on hover.
JavaScript by itself is quite powerful, but it’s difficult to work with without the help of some higher-level libraries that provide utility functions that are pre-written for you, so you don’t have to write everything from scratch. The de-facto standard library for data visualization applications is D3. D3 stands for data-driven documents. D3 has tons of utility functions that you’d need to produce data visualizations, but D3 becomes a bit cumbersome to work with when you have deeply nested structures, and it doesn’t really provide a way to subdivide your code into well-isolated components. And it also doesn’t really have any infrastructure for managing complicated interactions. That’s where React comes in. React has an amazing component system, and it has built-in conceptual frameworks for making complex interactive systems.
So this is what I mean when I say web technologies. HTML, CSS, SVG, JavaScript, D3, and React. These are the technologies that we’re going to work with, for this course. With these technologies in hand, we can visualize all the things!