
This project was commissioned by the Campaign Finance Institute to present and explore their comprehensive and ever-evolving database of campaign finance law. This work was developed in collarobation with Seemant Kulleen.

This project is Open Source:
https://github.com/cfinst/cfinst.github.io
A presentation was given at a D3 Meetup in Oakland, CA about this project by Curran Kelleher and Seemant Kulleen. Watch the video here (see also slides):
The goal of this project was to present the entire Campaign Finance Institute Law database to end users and allow them to explore it. The database contains information about laws in each US State, every other year going back to 1998.

One of the first prototypes, developed by Seemant, was the map above. At this point we did not fully understand the structure of the dataset, and it was satisfying to see a map on the screen as the basis for further discussions.

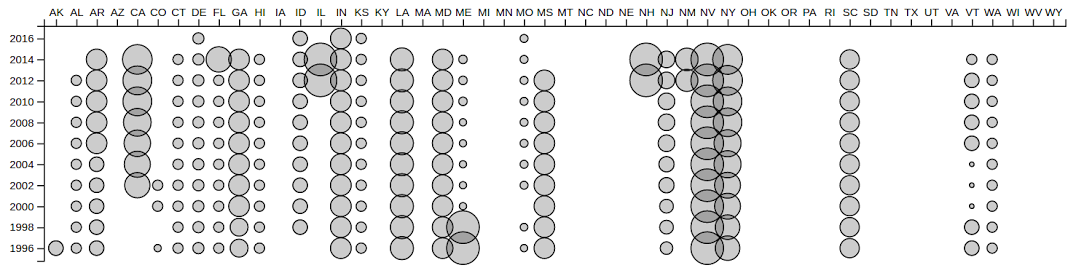
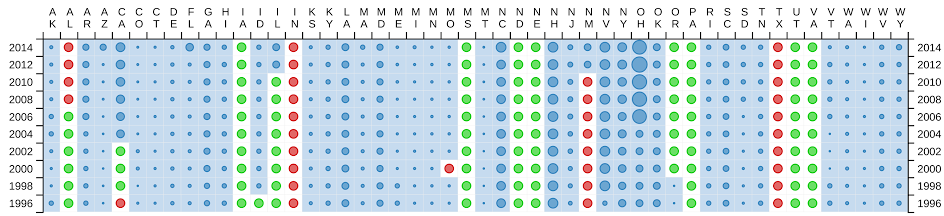
Another early prototype explored the grid layout, where years span from bottom to top and states from left to right. The combination of the map and the grid led ultimately to the final product.
We tried many things along the way.
It was a lot of fun.

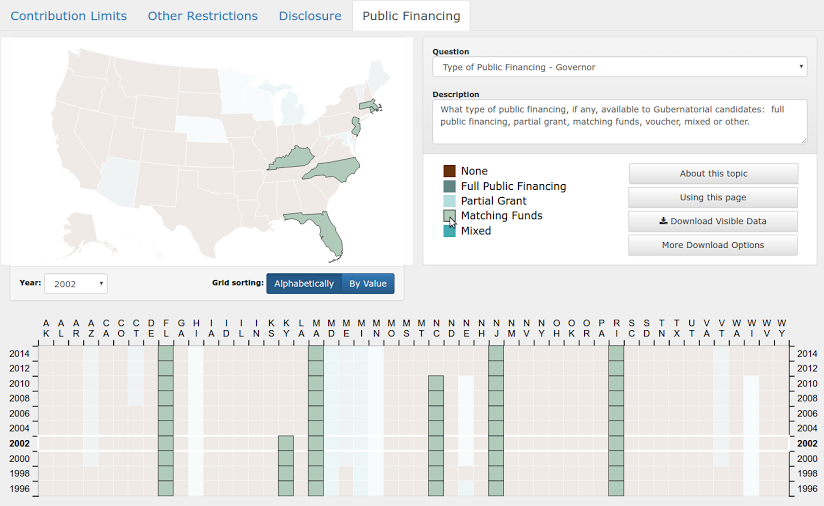
Once the map and grid were combined and had a shared color legend, it was possible to implement an interaction in which hovering on an item in the color legend causes the corresponding marks in both views to highlight. This allows users to quickly isolate specific values of interest.
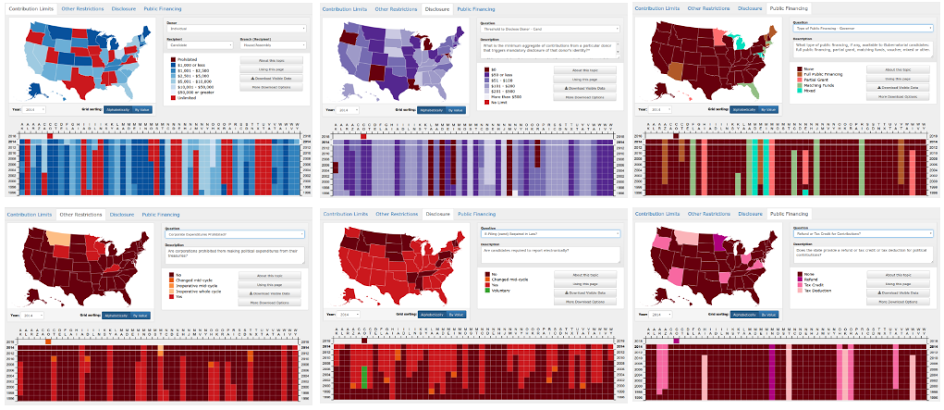
Based on client feedback we refined our focus to the map and grid layout, using consistent color schemes between all views. Having gained an understanding of the dataset structure, we were able to re-use the map and grid layout across many categories of the dataset by allowing users to navigate using menus and tabs. This approach ultimately provided end users with an interactive visual way to explore the data and ask questions of the database.