
What are the prerequisites?
Even if you live in a remote village of India, you should be able to take this course. All you need to take this course is an internet connection, a computer or mobile, time to invest in learning, and English language skills.
Do I need to know React already?
No, I’m gonna teach React as a part of this course.
How many hours per week do I need to put in?
Well, about 2:00 to 10:00. It’s a really a case of you get out what you put in.
How long is this course gonna be?
I’m thinking at least 12 weeks and it could go all year.
How many videos?
I’m thinking about three per week, and at least fifty in total.
What are the advantages of React over vanilla JavaScript?
I’d say they’re twofold — mainly and that is the component model that’s built into React, and also the State management infrastructure. These are things that are necessary when you start to develop more complex interactive data visualizations, but it may not be clear now why you need these at all. Let me give you some examples.

Here’s an interactive choropleth map from the 2018 version of my course. You can click on entries in this color legend to filter the selected class of region on the map.
Let me show you how this works under the hood. This is built just using D3, and nothing from React. It does use some notion of components – for example, the color legend component – it’s called as a function passing in this object of properties or parameters. This color legend component is defined as a function that takes as input a D3 selection and an object of properties. This works to some extent, but it’s just kind of a janky thing that I made up and nobody else uses, so it’s by no means an industry standard.
I think React does a much better job of allowing you to define components. And then there’s State management – for example, changing the state of the selected color in this example. It’s again, like a hand-rolled solution where when you click on one of these entries in the color legend, it just sets a local variable, and then calls this render function that renders the entire app again. This works, but it’s something that I kind of made up, and with this pattern there’s no real way to optimize it. Like, I haven’t figured out the equivalent in this world to the things that React gives you for free, for optimization, like useMemo, for example. So these are a couple of reasons why React would be a better approach.
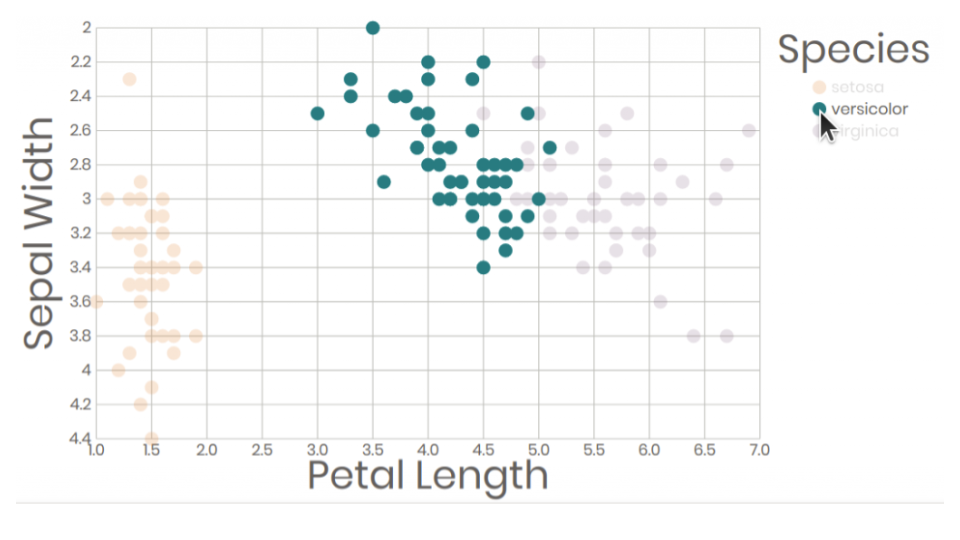
Let me show you an example of something similar to this using React. Here’s a scatterplot with an interactive color legend. If we take a peek under the hood, we can see that this is using standard React patterns. For example the useState hook to keep track of state. In this case, the hovered value which is the value of the currently hovered item in the color legend. This also uses React components for example, this color legend is inserted on the side by using React. This is JSX syntax. It looks kind of like HTML, but it’s something entirely different. This lets us implement things like a color legend using idiomatic React patterns, so since React provides all the stuff that we need out of the box, and it’s got so much mindshare in today’s world of JavaScript developers, I chose to use React + D3 for this course for relatively simple things.

Though like this cool optical illusion where you see dots in those intersections of the white lines that are not actually there, you don’t need any framework or library like D3 or React. You can just use vanilla JavaScript and that looks something like this. We use an old-school for loop to iterate 50 times and append 50 div elements to the page. This by the way is DOM manipulation – Document Object Model manipulation. The document object model is sort of the living HTML elements that you see on the page. You can change around dynamically with JavaScript this code. Here is what it looks like to do DOM manipulation using the built-in API provided by the browser application programming interface. D3 and React both invoke this API under the hood, so this example just uses vanilla JavaScript to insert a bunch of divs on the page and then it uses CSS to style these divs. The point here is that for simple things you don’t need any framework or library. The way I like to approach things is to do it in the simplest possible way, with the fewest possible dependencies first. And if it becomes too difficult, or you want to reach for something that’s provided by D3 or React, only then switch over to using those tools.
What about Python or Tableau and Power BI?
Why wouldn’t you use those tools to teach a data visualization course? Well, these tools are limited by what I like to think as the “abstraction barrier” These are all high-level tools, meaning they’re at a high level of abstraction. They provide components that you can instantiate, or things that you can just drag and drop, and then configure. Because of that, there is an abstraction barrier that you just can’t penetrate. If the developer of the tool didn’t foresee a certain thing that you want to do, a certain feature, then you just can’t do it in those tools. That’s not to say that they’re not useful or not beneficial, they are. You can do amazing things with these tools, but they’re essentially limited they’re limited in terms of the interactions that you can implement with them, and they’re limited in terms of how much you can customize your visualizations.
If you build something from scratch using D3 and React on the other hand, you have control over each and every detail. So the interactions that you can implement and the customizations that you can do are not limited. They’re unlimited. That’s one of the major reasons why I’m not using any of these tools to teach this course.
That brings us to our first assignment.
Find visualizations relating to current events share them in our course Slack or on Twitter with the hashtag #datavis2020. Also please comment on someone else’s share. That’s it for week 1 Q&A.