
Greetings! 2023 is the year that Datavis Tech is finally back in business, full swing, after several years of dormancy.
Schedule a free 15 minute exploratory conversation to get a project started! Services include
- Custom interactive data visualization design and development with D3.js (and maybe React)
- Standalone microsites, components for existing products, and everything in between
- Independent execution or deep collaboration with an existing team
- Fixed price and fixed scope projects
- Hourly rate projects with flexible scope (retainer model)
- On-demand coaching/consulting sessions – book an hour now!
A Brief History of Datavis Tech
Datavis Tech, as of April 2023, is just me, Curran Kelleher. I was an independent freelancer / consultant operating as Datavis Tech INC entity between 2016 and 2020. Those were wonderful years living mostly in India, where the cost of living is quite low. That gave me a rock solid foundation of remote work and collaboration that prepared me well for when Covid hit in 2020.
During those years from 2016 to 2020, I worked on a great variety of visualization projects for clients. Most of the clients were based in the US, but some also in Europe. In those years Datavis Tech was also an independent contractor for Stamen Design, on and off. Some notable Stamen projects I worked on during this time include the Facebook COVID-19 Mobility Dashboard and Global Superdiversity with the Max Planck Institute.
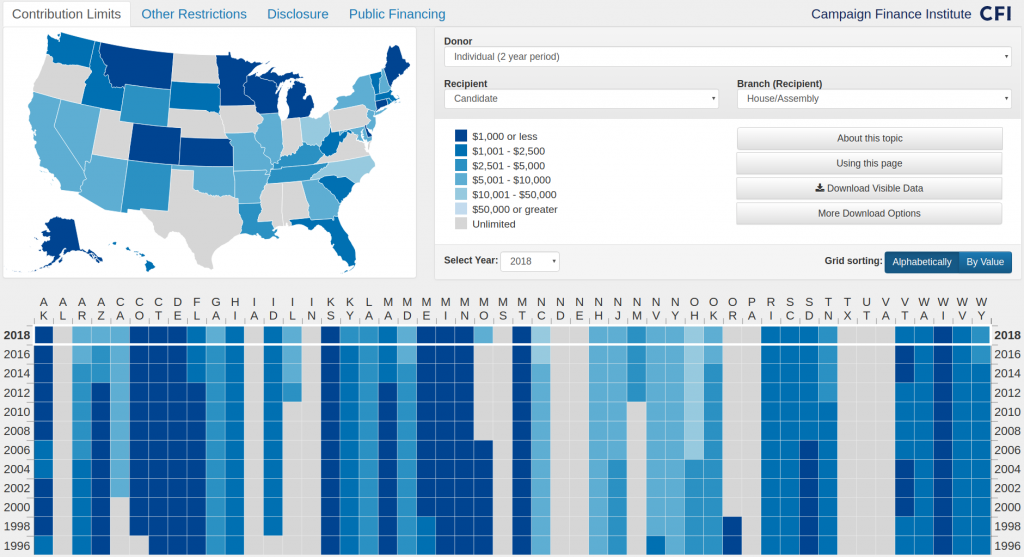
Much of the work from 2016-2020, as is typical in client services, was strictly confidential and proprietary. However a select few projects were public, and even open source! The Campaign Finance Institute project, visualizing historical US campaign finance law, was an amazing collaboration with Seemant Kulleen who I knew from the San Francisco / Oakland D3 meetup. That was my first client project and I learned a ton.
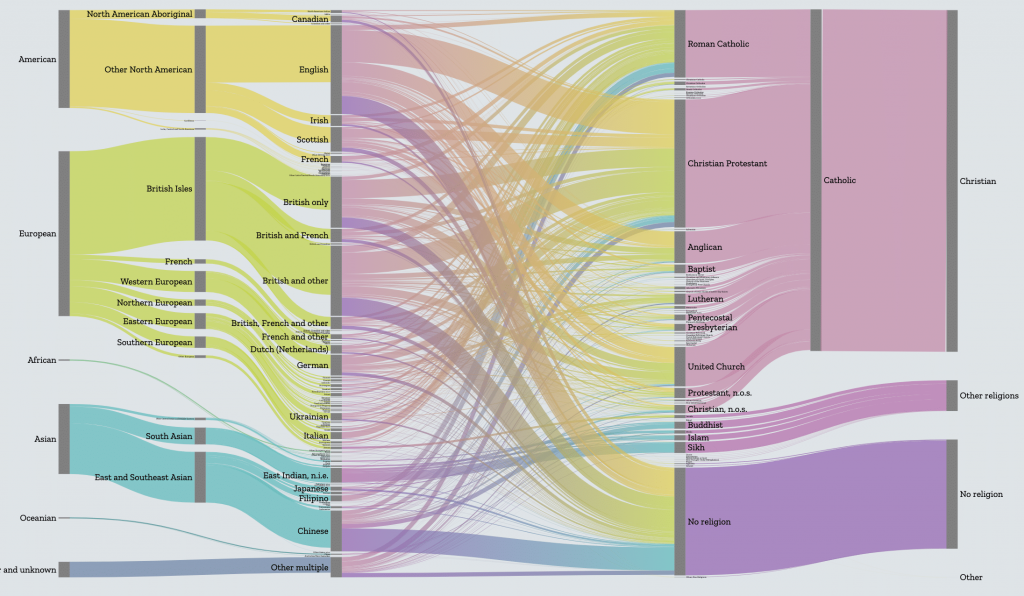
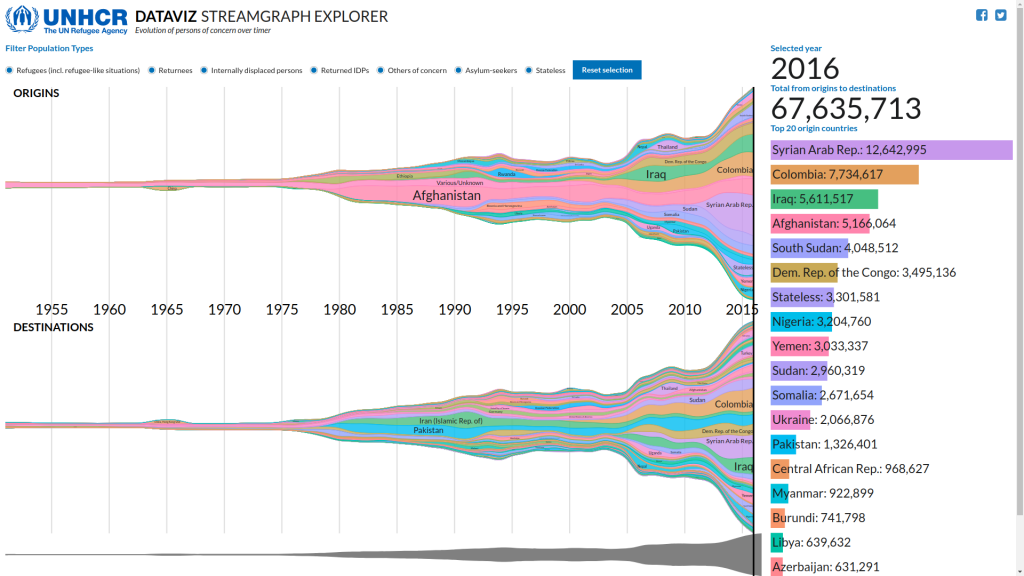
The Josquin Project, also a collaboration with Seemant, was a fascinating exploration of music data with researchers at Stanford. Finally the UNHCR Streamgraph Explorer was a project I did on my own as an independent contractor for the United Nations refugee agency. That was an interesting collaboration with folks based in Europe and Africa. Interestingly, this project is the one that led to lots of people discovering me and reaching out for services. The power of inbound marketing!
The Platform
All of this client work, though, was to support the original vision I had when founding Datavis Tech in 2016 – to build a platform for data visualization. This is what my Ph. D. thesis was about, and for years I worked in dataviz research labs building platforms. As I wanted to retain full ownership of the company I decided not to take venture capital, but rather bootstrap the company by paying the bills with consulting until the product was ready to sell. I never really wanted Datavis Tech to be a client services company, but that’s what it became in service of the vision of becoming a product company.
The first incarnation of the platform was hosted at datavis.tech and was super janky. Then I dropped some cash on the VizHub.com domain and build VizHub version 1. I taught an online graduate course with Worcester Polytechnic Institute in 2018 using VizHub 1. I then used some of my income from Stamen work to hire Stamen to redesign VizHub. I then spent about a year building those designs into a real product (in the midst of all the client services work), and that’s VizHub 2 which is operational today. At some point I introduced a paid plan (pay to make visualizations private), but it failed miserably. At its peak it had 15 paying customers. When I interviewed the customers, most of them signed up just because they wanted to support my work making free YouTube videos about dataviz and coding. There was no product-market fit. I think it was just not good enough and lacked core features that professionals need.
Dormancy
In October 2020 I returned to the US and took a full time position with Stamen Design. Having done numerous projects with Stamen already as an independent contractor (operating as Datavis Tech), it was a natural transition. Those folks are truly amazing. I had a fantastic time working on a wide range of projects for amazing clients with amazing collaborators and visionaries in the field. During this time I spent almost zero time developing VizHub, it was on the back burner.
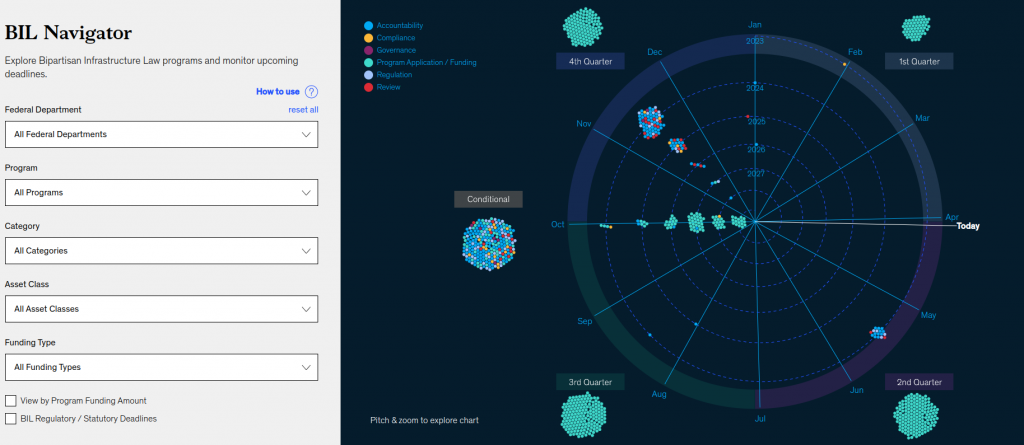
In January 2022 I took a full time position with McKinsey and Company. I had the opportunity work with the great Jason Forrest, director of the McKinsey The Data Visualization Lab. From Jason’s description of it on LinkedIn: “The Data Visualization Lab is an experimental studio that pairs advanced data visualization techniques with design thinking to communicate business insights. Our group works across industries and sectors and we prize interesting people that are always looking to experiment with innovative technologies and storytelling techniques.” Spot on! The work we did together was truly challenging and inspiring in terms of its scale. Most of the projects I worked on there are strictly confidential, however some are public: BIL Navigator (exploring a dataset of key dates from the Bipartisan Infrastructure Law legislation) and Supplier Diversity (we build the interactive map component there).
Revival
In January 2023 I left my full time position to again pursue the dream of building my own company. I’m very actively engaged in working on VizHub 3, the next generation of the VizHub platform. This is a complete re-write of the product and re-deployment on scalable industrial grade infrastructure. The aim of this generation of the platform is for professional use in client services. Having spent years working in client services doing custom data visualization development, I have a sense of the pain points that practitioners face, and have ideas for how to solve those. In particular around collaboration friction, inclusion of non-technical collaborators, access control issues, deployment issues, preview links (showing work-in-progress securely). The overall idea with VizHub 3 is that it will provide a number of “accelerators” that help individuals and teams deliver dataviz projects faster and better than without it. Sign up for the private beta program!
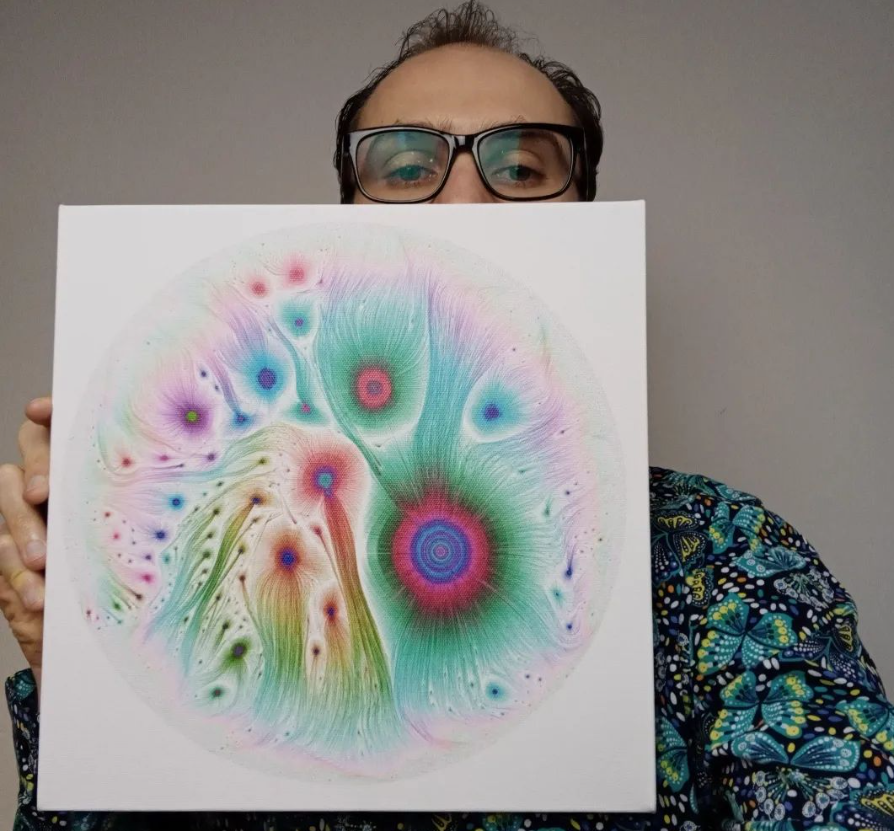
Another fun thing – while working on the data migration from the VizHub 2 data model to the VizHub 3 data model (which is fundamentally different and supports revision history), I visualized the content of the VizHub platform itself! I wasn’t sure if it could even be done, as it’s a tree of roughly 350K nodes (one for each “commit” in the revision history of a viz), but it actually worked! I used D3’s tree layout then fed that into D3’s force layout. I let the simulation run for about 16 hours or so and it finally converged to a gorgeous layout that highlights the fractal-like seemingly Power Law distribution of content. It was so striking I decided to make wall art of it and put that up for sale. You can buy a canvas print! This is fully automated dropshipping, which I’d like to one day enable for all VizHub users – imagine if you could sell canvas prints of your dataviz or digital art with the push of a button!
Current Services Offered
I’d like to explain the kind of services I can provide.
- Custom interactive data visualization design and development with D3.js (and maybe React). This is the kind of day-to-day work I have been doing since 2016. I know how to work remotely with teams and individual clients using tools like Slack, Discord, and various Kanban tools (I swear by Kangan and iterative development by the way!).
- Standalone microsites, components for existing products, and everything in between – These are the kinds of things I can build. Dataviz projects generally fall on a spectrum like this, where on the one side you have a “standalone microsite” that is truly standalone. This would involve spinning up a brand new domain, for example, and putting our dataviz project there as a full screen experience. One step away from this would be to embed the dataviz into an existing Web page or CMS like WordPress or Drupal (I have done it with both of these). At the other end of the spectrum is developing within an existing codebase for a product that already exists. I can work on all these various kinds of projects and have done so in the past.
- Independent execution or deep collaboration with an existing team – Sometimes a client comes to me and doesn’t have a technical team or a design team. This is fine – I can shoulder the full burden of designing and developing an entire project and pushing it through to a production site. In this case I prefer frequent check-ins to make sure we’re constanty aligned. On the other end of the spectrum, the client already has an entire team, including developers and designers, and needs to augment that team with a D3 specialist. I’m also very comfortable in this environment (I actually prefer this!).
- Fixed price and fixed scope projects – Some clients prefer to know up front what they will spend and what they will get in return. This is called “fixed price”. In this case, the requirements need to be nailed down and documented. Broadly speaking, the core features need to be defined as “in scope”. I also like to imagine potential scope creep (like “mobile support”, “image export”, or “deep linking”), and explicitly list those things as “out of scope”. I’m happy to work on projects like this. In these projects, when new feature ideas come up, we may want to draft a follow-up statement of work for another fixed price engagement.
- Hourly rate projects with flexible scope (retainer model) – Some clients prefer to just dive in and start collaborating, without full understanding of the project scope or how things might change. For these scenarios, I’m happy to do a “time and materials” contract, which is to charge an hourly rate, track time, and bill for those hours. For these projects I like to have a retainer model where a portion of the hours are paid for up-front, either as a one-off or a recurring monthly retainer.
- On-demand coaching/consulting sessions – book an hour now! – On the extreme end of the hourly rate model, you can book an individual hour of my time with that link and it will get dropped into our calendars! Sometimes you are already working with D3 but just are stuck on a particular thing for days and need a second pair of eyes on the problem to get “un-stuck”. I can help there. Also, if you’re doing a visualization project internally that’s just starting and need to generate tons of ideas, I can help there. You can use this time however you want to pick my brain, do some pair programming, or talk through whatever visualization related challenges you may be having.
Also check out:
- My work on VizHub
- My older work on bl.ocks.org
- My courses
- My YouTube Channel
- My Resume
- Instagram (mostly not related to dataviz, more random stuff from India)
Ironically, I find myself in much the same position I was way back in 2016 – turning to client services in order to fund product development! So, if you’re in need of the kind of services I can offer, feel free to schedule an exploratory call, book a 60 minute session, or send me an email at curran@datavis.tech. Looking forward to hearing from you!